Add MoEML Locations to the Agas Map
Introduction to the Agas Map
Our new (as of the end of 2014) implementation of the Agas Map is
based on the OpenLayers 3.0 library. It presents the map as a tiled image at
a range of different resolutions. Locations are plotted on the map in three
forms: Polygons (closed shapes), MultiLineStrings (lines with
multiple points), and Points. The information used to display locations
is provided to the map through two JSON files,
/db/data/generated/categories.json (providing information about all the location categories in our document typology),
and /db/data/generated/agasLocations.json (which provides information about the locations). These files are located in a folder
called generatingd because they are automatically generated from our XML documents. There is more information
on this below.
The view of the map which all users see can also be used to create new shapes,
lines and points for locations which are not yet on the map. This document will explain
how to do that.
Note that you can create a bookmark for any shape you draw; once the
shape is completed, press the Bookmark button, and
the browser will navigate to a new, rather complicated URL which encodes
the shape in its query string. You can send this URL to anyone; when a user
visits it, the same shape will be reconstructed, and the map will zoom
into it.
Creating a Polygon
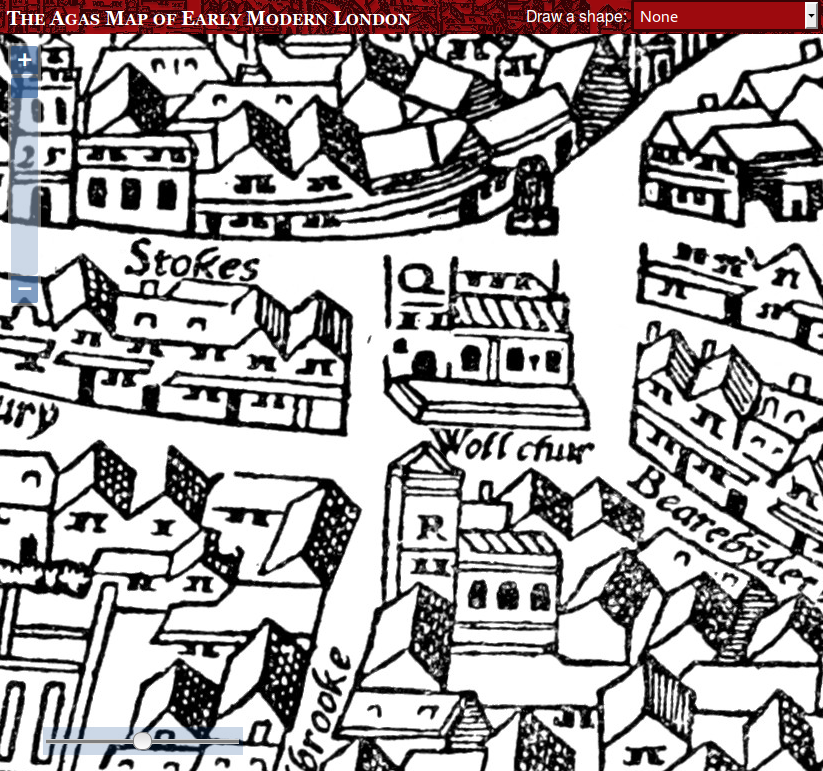
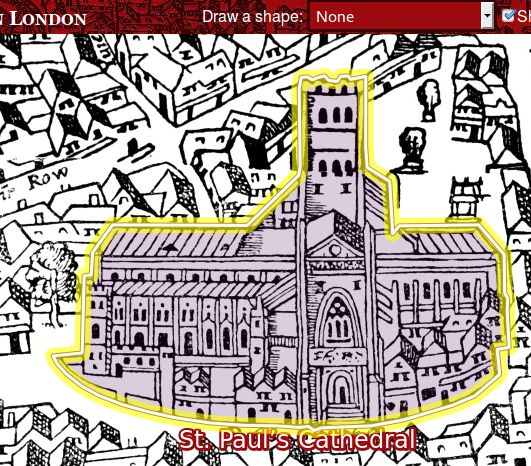
To create a polygon shape, first zoom right into the map so that the shape you want
to
outline is taking up most of the window. In this example, we’re going to outline St. Mary Woolchurch:
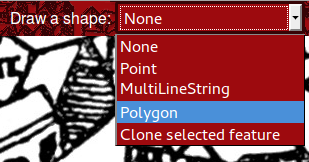
Then choose Polygon from the Draw a shape drop-down list:
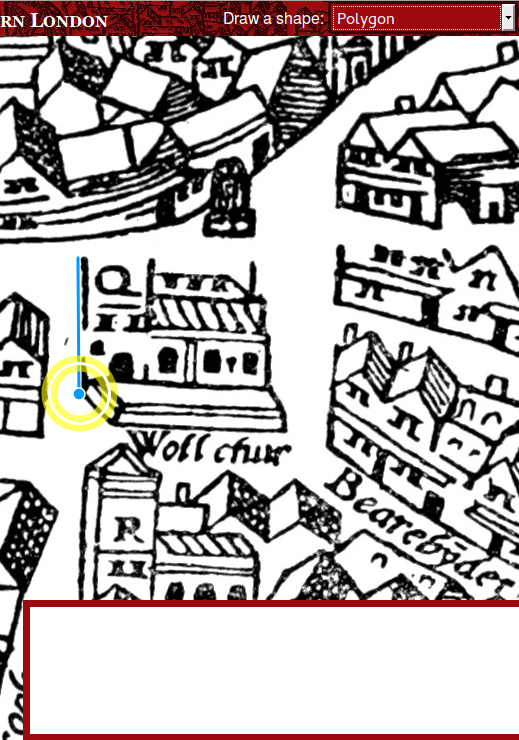
A red box appears at the bottom of the screen. We’ll see the purpose of this later.
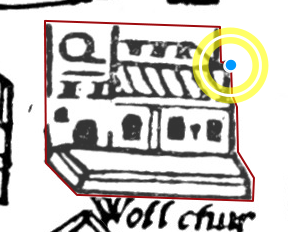
You’ll notice that the cursor turns to a blue point. Now you can click on one of the
corners of the object to add a point. Move your mouse to the next corner, and click
there to add the next point:
Keep adding points until you have outlined the whole object:
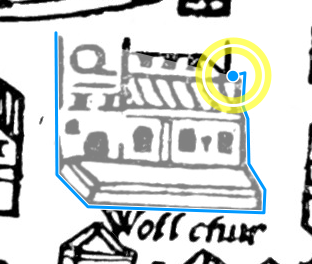
Click back on the original starting point to complete the shape.
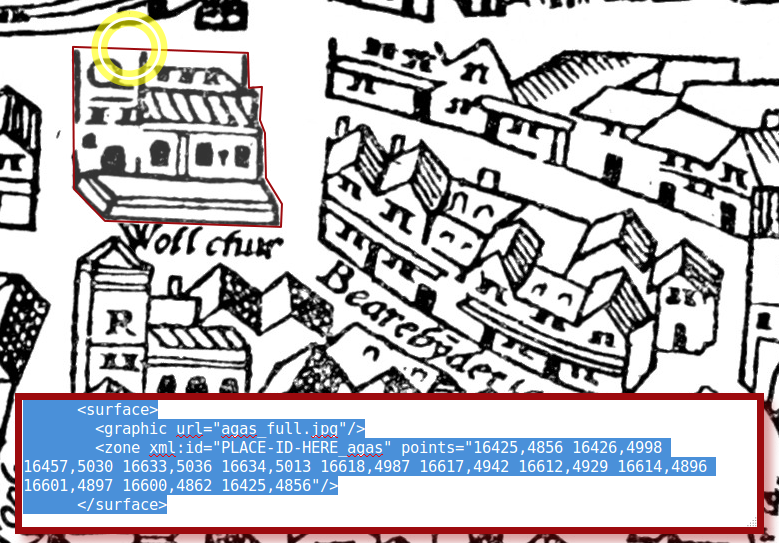
Two things will happen: the shape will change colour to show that is is complete,
and in the red box, a block of XML code will appear. This is the TEI
<surface> element that you need to add into the location file for the place. In Oxygen, open
up the appropriate location file (in this case, STMA37.xml), and locate the <facsimile> element.1 You may find that there is already a <surface> element in there from the old Agas map images. Leave this alone, but add the new
element immediately after it:
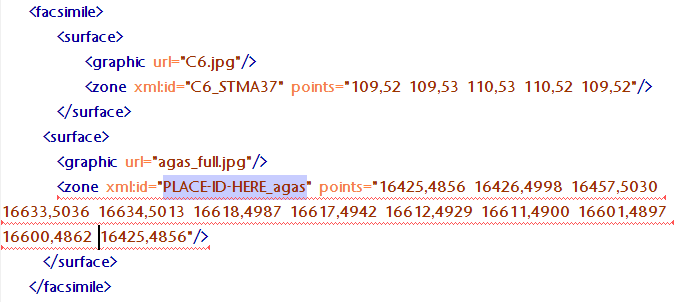
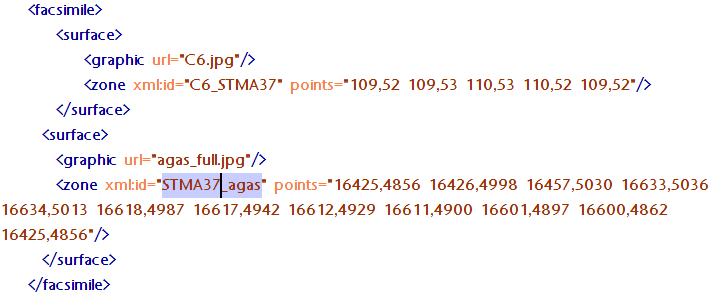
You’ll notice that this is invalid when we first paste it in, because the location
id is wrong. Change the first part of the
@xml:id attributee on the <zone> element to match the location id:
What if your shape is not perfect first time around? You can easily edit it after
it’s completed. Put your mouse over one of the existing points to click and move it;
put your mouse over one of the lines to add a new point. Every time you make a change
to the shape, the XML in the red box will update itself automatically.
If you need to delete one of the nodes in your shape, press the Shift key and click
on it.
It is best to have the map zoomed to its maximum size when you create the shape, because
you’ll be more accurate. If you’re outlining a large area, this may mean that the
shape does not completely fit on the screen. Don’t worry about this; even while you’re
in the middle of drawing the shape, you can still click and hold (hold down the mouse
button), drag the map around, and release without adding a new point in your shape.
It’s only when you click and release immediately that a new point is added.
Creating MultiLineStrings and Points
While we usually draw buildings as shapes, streets are drawn
as MultiLineStrings (in other words, a series of connected lines). The process is
exactly the same as for Polygons, except that to finish the shape,
you just double-click on the last point. When tracing a street, start the line in
the middle of the junction where the street starts, and end in the middle of the junction
where it ends. Keep the line in the middle of the street.
Some locations cannot be precisely outlined, perhaps because
although we know approximately where they were, they do not
actually appear on the map. You can use a Point for this. Creating
a Point is the simplest process of all: select Point from the drop-down list, then click on the location.
Creating a MultiPolygon
There will be some circumstances in which you need to associate multiple polygons
with a single
location. For example, imagine that a guild owns two buildings which are not contiguous;
in one sense,
they are the same
location,but they are clearly two separate shapes on the map.
This can be done by creating multiple
<zone> elements inside the <surface>
element for the map. Here is an example:
<surface>
<graphic url="agas_full.jpg"></graphic>
<zone xml:id="STBO4_1_agas" points="18913,6593 18919,6692 18983,6687 18994,6686 18995,6621 18995,6593 18913,6593"></zone>
<zone xml:id="STBO4_2_agas" points="18994,6681 18998,6708 19007,6721 19032,6721 19033,6682 18994,6681"></zone>
</surface>
Each <graphic url="agas_full.jpg"></graphic>
<zone xml:id="STBO4_1_agas" points="18913,6593 18919,6692 18983,6687 18994,6686 18995,6621 18995,6593 18913,6593"></zone>
<zone xml:id="STBO4_2_agas" points="18994,6681 18998,6708 19007,6721 19032,6721 19033,6682 18994,6681"></zone>
</surface>
<zone> has a different @xml:id, created by adding an underscore followed by a digit after
the main location id. You will have to draw each of these shapes separately on the
map, selecting
Polygon from the drop-down list; create the first one in the normal way, copying
the whole <surface> element into the location file, and then for each subsequent polygon, copy
only the <zone> element from the code box into the appropriate place as a sibling of the first one.
Note that you can only combine polygons in this way; you cannot create sets of MultiLineStrings
or Points.
Editing an Existing Location
Sometimes you will have to make changes to a location which has been entered by someone
else, and is already showing on the map. To do this, first zoom into the location
and select it:
Then choose Clone selected feature from the drop-down list. The shape will turn into a red outline which you can edit
as explained above. As you edit, the XML in the red box will change, and when you’re
happy with the result, you can copy/paste the XML into the location
file, replacing the original
<surface> element.
Bookmarking Shapes
Just as you can bookmark locations or sets of locations,
you can also bookmark a shape you have created. This can be handy if you’re emailing
someone and would like to refer
to a specific location on the map, or if you would like to suggest a particular location
for inclusion. To do this, simply create the
shape as you normally would, and then when you’ve finished, press the Bookmark button. A long,
inscrutable URL will be created. If you plug this URL into a browser, the map will
recreate the shape and zoom in on it,
also showing the TEI
<surface> element at the bottom of the screen.
Uncertainty and Imprecision
It is often the case that a feature may not appear on the Agas Map, although we know
more or less where it
should be if it did appear; or that we know more or less, but not exactly, where a
feature is. In order to be truthful,
we need to record the level of certainty and precision associated with a location.
The
<certainty> and <precision> elements enable us to do that. We use <certainty> to quantify
our confidence that the location assigned is the correct location; and we use <precision> to quantify how
accurateour point or outline is assumed to be. This is perhaps best explained through examples.
<zone xml:id="ROSE66_agas" points="14676,9076 14910,9081 14918,9405 14684,9401 14676,9076">
<precision precision="low" resp="mol:HOLM3"></precision>
<certainty cert="medium" resp="mol:HOLM3" locus="value"></certainty>
</zone>
<precision precision="low" resp="mol:HOLM3"></precision>
<certainty cert="medium" resp="mol:HOLM3" locus="value"></certainty>
</zone>
The
<precision> and <certainty> elements appear as children of the <zone> element to which
they refer. In the absence of these elements, certainty and precision are assumed
to be high. The @precision
and @cert attributes record the level of certainty or precision in each case;
allowed values are "high" | "medium" | "low" | "unknown".
It is always good practice to provide @resp
to identify someone (usually yourself) as the person responsible for introducing or
encoding this expression of doubt;
and where appropriate, you might also provide @source to point to one or more sources of evidence.
The method outlined above is relatively crude; it allows us to say that the feature
may not in fact be at the location
specified (
<certainty>) and/or that the coordinates provided may be somewhat inaccurate (<precision>).
You may wish to add
a <note> inside the <zone> to clarify the situation for a human reader, and it is also possible to provide
much more specificity in the encoding if we determine that this is desirable. If the
location consists of more than one zone, add a <note> inside <surface>.
Note also that using this method, it is possible to encode multiple possible locations
for a single feature, each with
its own level of certainty; you might believe that it is most likely in one place
(
@cert="medium") but that
it could possibly be somewhere else (@cert="low"), and each location can have its own <zone>
element containing a <certainty> element, with @source pointing to the evidence available.
<facsimile>
<surface>
<note type="editorial" resp="mol:JENS1">The southern half of the alley, if it existed, would have been destroyed for the building of the Royal Exchange. The northern half ran east of St. Christopher le Stocks. Neither half is visible on the 1633 version of the Agas Map.</note>
<graphic url="agas_full.jpg"></graphic>
<zone cert="medium" xml:id="CHRI4_1_agas" ulx="16783" uly="4684" lrx="16883" lry="4817"></zone>
<zone cert="low" xml:id="CHRI4_2_agas" ulx="16687" uly="4562" lrx="16749" lry="4656"></zone>
</surface>
</facsimile>
Uploading New Location Data to the Server
In order for a new location to appear on the live map on the website, two things need
to happen:
-
The JSON data used by the map needs to be regenerated from the XML.
-
The regenerated JSON files and the changed XML location files must be uploaded to the server.
To regenerate the JSON data:
-
Make sure you have the MoEML project open in Oxygen (Project/Open Project, then locate the
moeml.xprproject file in/db/dataor in the root of your MoEML documents). -
Open the file /db/data/utilities/createAgasJson.xsl.
-
Run its default transformation (Document/Transformation/Apply Transformation Scenario(s), or click on the red triangle button on the toolbar).
Check that the JSON files are both good by opening them in Oxygen; Oxygen should be
able to check the syntax of the files, and will show you errors if something is wrong
with them.
If the files are good, then upload them to the eXist database, along with the XML
location files you have changed, in the appropriate locations. Then reload the map
in your browser (holding down the Shift key while you press the Reload button, to
make sure you get a fresh copy of all the code), and check that your new locations
are working properly.
Notes
- If there’s no
<facsimile>element, just add one immediately before the<text>element.↑
Cite this page
MLA citation
Add MoEML Locations to the Agas Map.The Map of Early Modern London, edited by , U of Victoria, 20 Jun. 2018, mapoflondon.uvic.ca/agas_locations.htm.
Chicago citation
Add MoEML Locations to the Agas Map.The Map of Early Modern London. Ed. . Victoria: University of Victoria. Accessed June 20, 2018. http://mapoflondon.uvic.ca/agas_locations.htm.
APA citation
2018. Add MoEML Locations to the Agas Map. In (Ed), The Map of Early Modern London. Victoria: University of Victoria. Retrieved from http://mapoflondon.uvic.ca/agas_locations.htm.
RIS file (for RefMan, EndNote etc.)
Provider: University of Victoria
Database: The Map of Early Modern London
Content: text/plain; charset="utf-8"

TY  - ELEC
A1  - Holmes, Martin
ED  - Jenstad, Janelle
T1  - Add MoEML Locations to the Agas Map
T2  - The Map of Early Modern London
PY  - 2018
DA  - 2018/06/20
CY  - Victoria
PB  - University of Victoria
LA  - English
UR  - http://mapoflondon.uvic.ca/agas_locations.htm
UR  - http://mapoflondon.uvic.ca/xml/standalone/agas_locations.xml
ER  -
RefWorks
RT Web Page
SR Electronic(1)
A1 Holmes, Martin
A6 Jenstad, Janelle
T1 Add MoEML Locations to the Agas Map
T2 The Map of Early Modern London
WP 2018
FD 2018/06/20
RD 2018/06/20
PP Victoria
PB University of Victoria
LA English
OL English
LK http://mapoflondon.uvic.ca/agas_locations.htm
TEI citation
<bibl type="mla"><author><name ref="#HOLM3"><surname>Holmes</surname>, <forename>Martin</forename> <forename>D.</forename></name></author> <title level="a">Add <title level="m">MoEML</title> Locations to the Agas Map</title>. <title level="m">The Map of Early Modern London</title>, edited by <editor><name ref="#JENS1"><forename>Janelle</forename> <surname>Jenstad</surname></name></editor>, <publisher>U of Victoria</publisher>, <date when="2018-06-20">20 Jun. 2018</date>, <ref target="http://mapoflondon.uvic.ca/agas_locations.htm">mapoflondon.uvic.ca/agas_locations.htm</ref>.</bibl>Personography
-
Janelle Jenstad
JJ
Janelle Jenstad, associate professor in the department of English at the University of Victoria, is the general editor and coordinator of The Map of Early Modern London. She is also the assistant coordinating editor of Internet Shakespeare Editions. She has taught at Queen’s University, the Summer Academy at the Stratford Festival, the University of Windsor, and the University of Victoria. Her articles have appeared in the Journal of Medieval and Early Modern Studies, Early Modern Literary Studies, Elizabethan Theatre, Shakespeare Bulletin: A Journal of Performance Criticism, and The Silver Society Journal. Her book chapters have appeared (or will appear) in Performing Maternity in Early Modern England (Ashgate, 2007), Approaches to Teaching Othello (Modern Language Association, 2005), Shakespeare, Language and the Stage, The Fifth Wall: Approaches to Shakespeare from Criticism, Performance and Theatre Studies (Arden/Thomson Learning, 2005), Institutional Culture in Early Modern Society (Brill, 2004), New Directions in the Geohumanities: Art, Text, and History at the Edge of Place (Routledge, 2011), and Teaching Early Modern English Literature from the Archives (MLA, forthcoming). She is currently working on an edition of The Merchant of Venice for ISE and Broadview P. She lectures regularly on London studies, digital humanities, and on Shakespeare in performance.Roles played in the project
-
Author
-
Author of Abstract
-
Author of Stub
-
Author of Term Descriptions
-
Author of Textual Introduction
-
Compiler
-
Conceptor
-
Copy Editor
-
Course Instructor
-
Course Supervisor
-
Course supervisor
-
Data Manager
-
Editor
-
Encoder
-
Encoder (Structure and Toponyms)
-
Final Markup Editor
-
GIS Specialist
-
Geographic Information Specialist
-
Geographic Information Specialist (Modern)
-
Geographical Information Specialist
-
JCURA Co-Supervisor
-
Main Transcriber
-
Markup Editor
-
Metadata Co-Architect
-
MoEML Transcriber
-
Name Encoder
-
Peer Reviewer
-
Primary Author
-
Project Director
-
Proofreader
-
Researcher
-
Reviser
-
Second Author
-
Second Encoder
-
Toponymist
-
Transcriber
-
Transcription Proofreader
-
Vetter
Contributions by this author
Janelle Jenstad is a member of the following organizations and/or groups:
Janelle Jenstad is mentioned in the following documents:
-
-
Tye Landels-Gruenewald
TLG
Research assistant, 2013-15, and data manager, 2015 to present. Tye completed his undergraduate honours degree in English at the University of Victoria in 2015.Roles played in the project
-
Author
-
Author of Term Descriptions
-
CSS Editor
-
Compiler
-
Conceptor
-
Copy Editor
-
Data Manager
-
Editor
-
Encoder
-
Geographic Information Specialist
-
Markup Editor
-
Metadata Architect
-
MoEML Researcher
-
Name Encoder
-
Proofreader
-
Researcher
-
Toponymist
-
Transcriber
Contributions by this author
Tye Landels-Gruenewald is a member of the following organizations and/or groups:
Tye Landels-Gruenewald is mentioned in the following documents:
-
-
Kim McLean-Fiander
KMF
Director of Pedagogy and Outreach, 2015–present; Associate Project Director, 2015–present; Assistant Project Director, 2013-2014; MoEML Research Fellow, 2013. Kim McLean-Fiander comes to The Map of Early Modern London from the Cultures of Knowledge digital humanities project at the University of Oxford, where she was the editor of Early Modern Letters Online, an open-access union catalogue and editorial interface for correspondence from the sixteenth to eighteenth centuries. She is currently Co-Director of a sister project to EMLO called Women’s Early Modern Letters Online (WEMLO). In the past, she held an internship with the curator of manuscripts at the Folger Shakespeare Library, completed a doctorate at Oxford on paratext and early modern women writers, and worked a number of years for the Bodleian Libraries and as a freelance editor. She has a passion for rare books and manuscripts as social and material artifacts, and is interested in the development of digital resources that will improve access to these materials while ensuring their ongoing preservation and conservation. An avid traveler, Kim has always loved both London and maps, and so is particularly delighted to be able to bring her early modern scholarly expertise to bear on the MoEML project.Roles played in the project
-
Associate Project Director
-
Author
-
Author of MoEML Introduction
-
CSS Editor
-
Compiler
-
Contributor
-
Copy Editor
-
Data Contributor
-
Data Manager
-
Director of Pedagogy and Outreach
-
Editor
-
Encoder
-
Encoder (People)
-
Geographic Information Specialist
-
JCURA Co-Supervisor
-
Managing Editor
-
Markup Editor
-
Metadata Architect
-
Metadata Co-Architect
-
MoEML Research Fellow
-
MoEML Transcriber
-
Proofreader
-
Researcher
-
Second Author
-
Secondary Author
-
Secondary Editor
-
Toponymist
-
Vetter
Contributions by this author
Kim McLean-Fiander is a member of the following organizations and/or groups:
Kim McLean-Fiander is mentioned in the following documents:
-
-
Joey Takeda
JT
Programmer, 2018-present; Junior Programmer, 2015 to 2017; Research Assistant, 2014 to 2017. Joey Takeda is an MA student at the University of British Columbia in the Department of English (Science and Technology research stream). He completed his BA honours in English (with a minor in Women’s Studies) at the University of Victoria in 2016. His primary research interests include diasporic and indigenous Canadian and American literature, critical theory, cultural studies, and the digital humanities.Roles played in the project
-
Author
-
Author of Abstract
-
Author of Stub
-
CSS Editor
-
Compiler
-
Conceptor
-
Copy Editor
-
Data Manager
-
Date Encoder
-
Editor
-
Encoder
-
Encoder (Bibliography)
-
Geographic Information Specialist
-
Geographic Information Specialist (Agas)
-
Junior Programmer
-
Markup Editor
-
Metadata Co-Architect
-
MoEML Encoder
-
MoEML Transcriber
-
Programmer
-
Proofreader
-
Researcher
-
Second Author
-
Toponymist
-
Transcriber
-
Transcription Editor
Contributions by this author
Joey Takeda is a member of the following organizations and/or groups:
Joey Takeda is mentioned in the following documents:
-
-
Martin D. Holmes
MDH
Programmer at the University of Victoria Humanities Computing and Media Centre (HCMC). Martin ported the MOL project from its original PHP incarnation to a pure eXist database implementation in the fall of 2011. Since then, he has been lead programmer on the project and has also been responsible for maintaining the project schemas. He was a co-applicant on MoEML’s 2012 SSHRC Insight Grant.Roles played in the project
-
Author
-
Author of abstract
-
Conceptor
-
Encoder
-
Name Encoder
-
Post-conversion and Markup Editor
-
Programmer
-
Proofreader
-
Researcher
Contributions by this author
Martin D. Holmes is a member of the following organizations and/or groups:
Martin D. Holmes is mentioned in the following documents:
-
Locations
-
St. Mary Woolchurch is mentioned in the following documents:
